You're watching a Solana token climb on a trading screen. Its volume looks impressive, its price still looks cheap, and you're wondering whether to buy. But does that headline price reflect a trade you could make, or a small swap in a thin pool?
Crypto market data helps you answer that question. The useful habit isn't watching more numbers. It's checking what each number measures, where it came from, and whether it's fresh enough for your decision.
What Crypto Market Data Covers
Think of crypto market data as a stock ticker and a shop's till receipts combined. The ticker shows prices. The receipts show completed transactions, while the order book or trading pool helps you judge what might happen when someone trades next.
The scale is substantial: the International Monetary Fund reported that total crypto-asset market capitalization rose from less than $20 billion in January 2017 to more than $3 trillion in November 2021. That's historical context, not a current valuation.
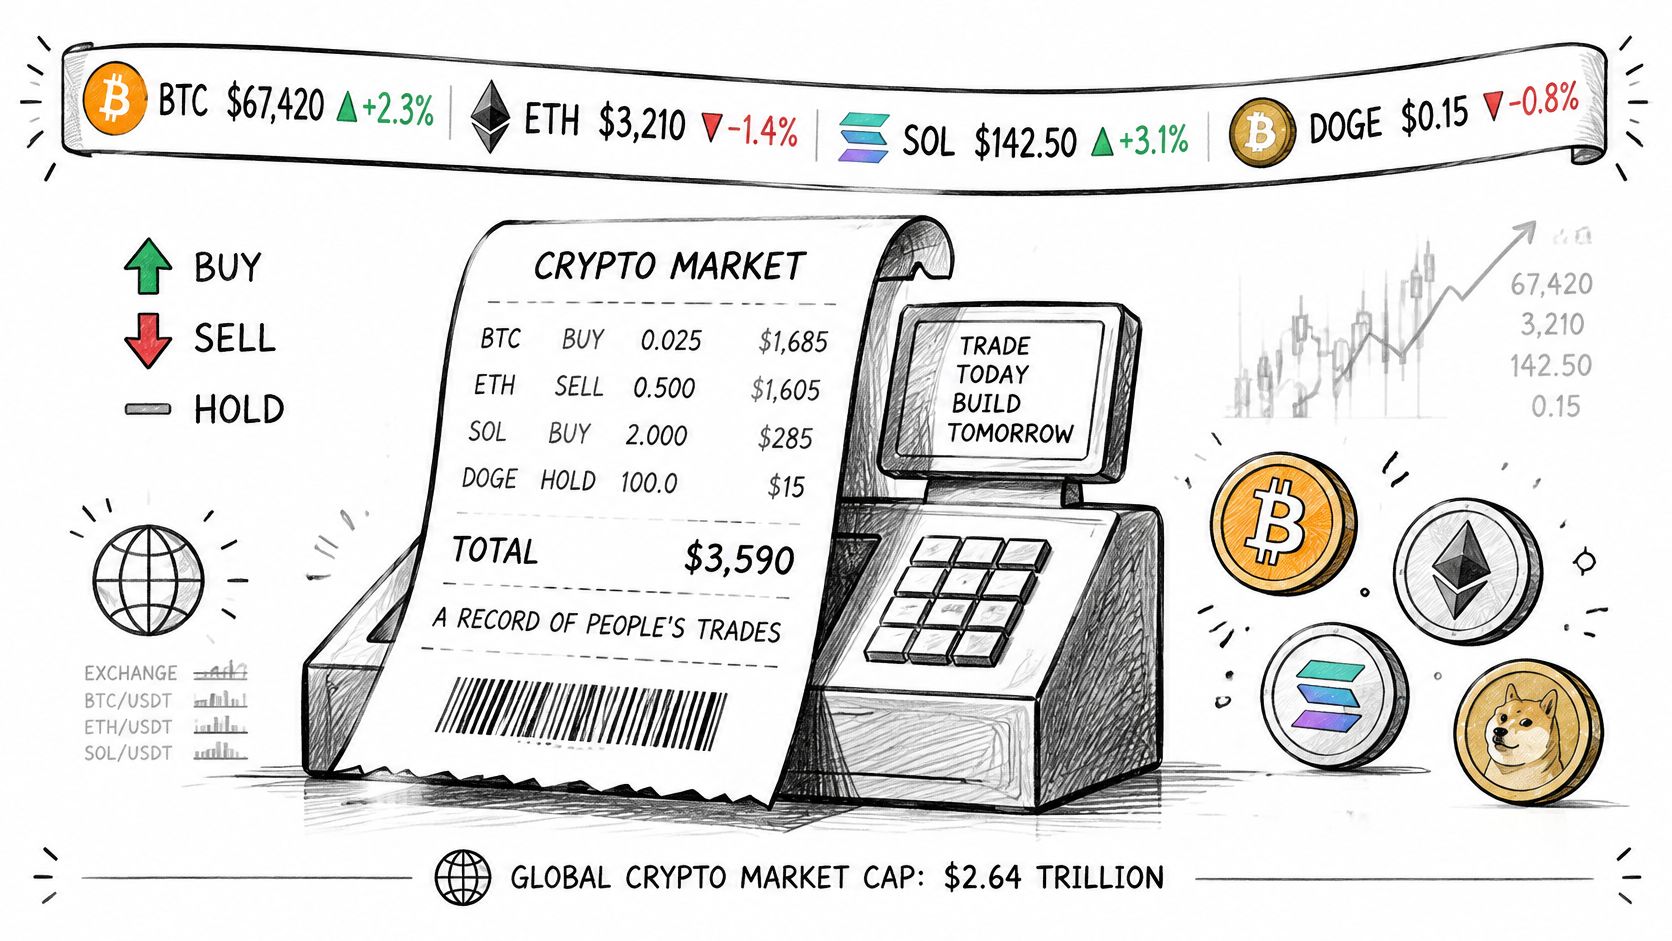
Market capitalization means price multiplied by circulating supply. In a hypothetical example, a token priced at $2, with 100 million circulating tokens, has a $200 million market cap.
That doesn't mean buyers invested that amount, or that holders could collectively sell for it. It values the circulating tokens at the quoted price.
Core crypto market data types
The numerical examples below are hypothetical, not live market readings.
| Data type | What it tells you | Example |
|---|---|---|
| Price | Latest traded price of a token or pair | 1 SOL trades at a quoted USD price right now |
| Volume | Amount traded over a set period | 24-hour trades worth $50 million on one pair |
| Order book | Open buy and sell orders at each price level | 10 buy orders stacked just below the price |
| Trades | Each executed buy or sell with time and size | A timestamped purchase of SOL using USDC |
| Market cap | Price multiplied by circulating supply | $2 multiplied by 100 million circulating tokens equals $200 million |
| Liquidity | Depth of orders or pool reserves at a price | A pool holding $1 million per side absorbs a $10,000 trade with relatively little price impact, subject to its pricing rules |
Volume describes past activity; liquidity helps assess your next trade. A busy token can still be difficult to sell without moving its price.
Practical rule: Check at least two data types before trusting a signal. A rising price deserves a liquidity check, not an automatic buy.
How Market Data Reaches Your App
A REST API works like asking a question and receiving an answer. Your app requests information, the server responds, and that exchange ends. A WebSocket stream works like an open phone line: the connection stays open so the server can send updates.
Neither method is automatically better. Choose according to whether your app needs a snapshot or a continuing sequence of changes.
Delivery methods and when to use them
| Method | Best for | Trade-off | Example |
|---|---|---|---|
| REST API | Historical prices, portfolio totals, reports | You must ask again to see updates | Fetch the last 30 days of daily closing prices |
| WebSocket stream | Live prices, trades and alerts | Your app must handle reconnects and message order | Receive each trade on a token as it happens |
| Polling REST every few seconds | Simple dashboards | Wastes requests and can miss short spikes | Request a price every 5 seconds |
| Node or RPC subscription | Raw on-chain events | Needs decoding and more infrastructure | Watch a pool account for balance changes |
The request periods in this table are example configurations, not performance guarantees.
Build a snapshot, then maintain it
Say you're building a token chart. Start by fetching historical candles through REST. A candle summarizes trading during a defined interval, usually including opening, highest, lowest and closing prices, plus volume.
Then subscribe to live updates. Your app uses incoming trades to update the current candle rather than repeatedly downloading the entire chart.
Disconnections need deliberate handling. A reconnected socket doesn't necessarily deliver everything your app missed, so keep the last processed event identifier and retrieve missing records where the provider supports it.
- Prevent duplicates. Don't count a trade again when it appears in both a recovery response and the live stream.
- Preserve ordering. Use event identifiers, sequence information or blockchain position where available.
- Show connection status. A frozen price should look disconnected, not reassuringly stable.
Raw RPC subscriptions serve a different purpose. They expose blockchain changes, but your application still needs to interpret account layouts and transaction instructions before displaying a meaningful swap.
Use REST for history and snapshots, and WebSocket for changes happening now. Most serious market-data applications need both.
Where Crypto Market Data Comes From
Delivery method and data origin aren't the same thing. A WebSocket connection might carry exchange trades, decoded blockchain events or an aggregator's calculated prices. The connection tells you how updates arrive, not what those updates represent.
There are several useful origins, each with a different boundary.
Data sources and their limits
| Source | What it provides | Main limit | Example |
|---|---|---|---|
| Centralized exchange API | Order book, trades and candles | Shows only one venue | Bitcoin to USDT trades on one exchange |
| Blockchain node or RPC | Every confirmed transaction and account state within the queried scope | Raw data that must be decoded | A Solana swap with token amounts in the transaction |
| DEX pool data | Pool reserves, swaps and liquidity events | Depth differs widely between pools | Reserves of a SOL and USDC pool |
| Aggregator or data provider | Unified prices, volume and risk scores | Derived figures are estimates | One price for a token across many DEXes |
A centralized exchange feed fits a strategy that trades on that exchange. Its order book shows available orders there, not the inventory available throughout crypto.
Blockchain records let developers inspect decentralized exchange activity without relying on a centralized exchange's reporting. However, a transaction isn't automatically a trade. Transfers, liquidity deposits and routed swaps need different treatment, and a routed swap can involve several pools.
Match the source to the decision
Suppose a wallet displays a broad portfolio estimate. An aggregator's normalized token prices may be convenient. If that wallet prepares a specific swap, it needs an executable route quote rather than assuming the portfolio price is available for the whole order.
A pool-level feed helps investigate the route. Check which assets the pool holds, how its pricing mechanism works and whether liquidity is available around the intended execution price.
A blockchain record can be accurate while your interpretation is wrong. Decode the action before assigning it a market label.
Before using a feed, confirm:
- Timestamp meaning. Does it identify the underlying event or the provider's latest calculation?
- Venue scope. Does the figure cover a pool, an exchange or an aggregated selection?
- Calculation method. Is it an observed transaction amount or a derived estimate?
Those distinctions explain why reputable screens can show different values without either screen necessarily being broken.
How Apps Use Market Data in Practice
Useful applications turn observations into specific actions. A price alert, a portfolio tracker and a swap preview may display the same token, but they need different inputs and safeguards.
Consider these practical examples:
Price alert. In a hypothetical wallet, a user requests a notification when a token moves 5% within 10 minutes. The app maintains a rolling price window through a WebSocket feed and compares equivalent prices from a consistent source. It should avoid sending repeated notifications for the same move.
Portfolio value. A hypothetical tracker refreshes a REST snapshot every minute, multiplies each token balance by its current price, and adds the results. If a token lacks a usable price, show it as unpriced rather than assigning zero without notice. The displayed total estimates current holdings; it doesn't establish trading profit or guaranteed sale proceeds.
Solana swap preview. The app combines a route quote with network fees and any required account creation. Solana's transaction-fee documentation specifies a 5,000-lamport base fee per signature, so a one-signature transaction without a priority fee costs 0.000005 SOL, while two signatures cost 10,000 lamports.
Keep execution costs separate
Priority-fee units matter. Under Solana's priority-fee formula, a 200,000-compute-unit limit at 5 micro-lamports per compute unit adds ceil(5 × 200,000 ÷ 1,000,000), which equals 1 lamport; a price of 5,000 micro-lamports instead adds 1,000 lamports, producing a 6,000-lamport total with one signature.
Failure doesn't eliminate network charges: Solana's fee-structure documentation explains that fees are charged whether a transaction succeeds or fails. For the higher-priority example, label the amount as fee paid for a failed trade if execution fails, rather than hiding it in successful-swap costs.
Account creation is another line item. Solana's payments documentation lists approximately 0.0029 SOL for account creation, which may apply when a user first receives a token and needs the corresponding token account.
Alerts need speed, portfolio values need freshness, and swap previews need precise units and complete cost labels.
Common Mistakes When Reading Market Data
| Metric | Common mistake | Better check |
|---|---|---|
| Trading volume | Treating high 24-hour volume as proof of demand | Check unique traders and whether turnover is automated |
| Market cap | Comparing tokens by price alone | Multiply price by circulating supply, not total supply |
| Current price | Trusting a quote that is seconds old | Check the timestamp and reject stale quotes |
| Liquidity | Assuming a large pool absorbs any trade | Check price impact for your trade size |
| Volatility | Sizing positions from one calm week | Compare with the long history before choosing a size |
A dashboard's largest number isn't necessarily its most useful number. Repeated buying and selling can produce substantial gross volume without equivalent net buying, while concentrated activity can make a token look more broadly traded than it is.
For a Solana token, inspect trade sizes, repeat-wallet behavior and net flows alongside turnover. Automated activity isn't automatically fraudulent, but it shouldn't be mistaken for independent buyers building positions.
The hidden trap is stale information
A quote can be correct when published and unusable when your order arrives. A live-trading study involving Bybit and Binance associated execution discrepancies with exchange or communication delays, volatility and order-book liquidity, with worse immediate execution outcomes when delays and volatility rose while liquidity fell.
Store both an event timestamp, when the market event occurred, and a receipt timestamp, when your system received it. Track sequence gaps and reject quotes beyond your chosen age limit rather than treating every received message as current.
Volatility also deserves historical context: the Wells Fargo Investment Institute reported that Bitcoin's annualized volatility was often 50% to 80% over the preceding eight-year period, compared with approximately 15% to 20% for the S&P 500. These are historical annualized measures, not forecasts of tomorrow's move.
A recent calm period isn't a reason to assume you can exit a large position easily during stress.
Before acting, run these checks:
- Verify identity and scope. Confirm the token's mint address, trading pair and included venues.
- Test executable size. Request a quote for your intended amount, including costs and price impact.
- Check operating conditions. Confirm feed health, current liquidity and whether recent volatility changes your risk tolerance.
Pick Your First Data Feed and Test It
Start with REST for history or reports. Add a WebSocket stream for live alerts or trading. Don't build a complex streaming system for a dashboard that only needs occasional refreshes.
Your first test should answer a narrow question. Can you reconstruct a token's trades, maintain a portfolio estimate or detect liquidity removal? A feed that handles one task well may still lack the fields another task requires.
Define the question. Write down the output you need, such as a current price, completed swaps or liquidity changes. Identify the fields needed to calculate it.
Choose the origin. Use an exchange feed for that venue, decoded on-chain data for decentralized trading coverage, or an aggregator for normalized cross-venue information. Confirm which pools and protocols are included.
Run a controlled comparison. If available, test a free tier. For example, compare two feeds for the same token over one hour, matching venue coverage and timestamp definitions before judging differences.
Record freshness. Save event and receipt times, identifiers and connection interruptions. Keep enough information to distinguish a missing event from a delayed one.
Add execution safeguards. Test liquidity and price impact before turning a signal into a trade. For speculative tokens, MemeAssist's guide can help you find reliable meme coin risk scanners, alongside your own liquidity and wallet checks.
A Solana-focused option
For Solana projects, review the Data API documentation against that checklist. Our Data API has 70+ endpoints covering tokens, wallets, trades, prices and risk scores, indexed and served in milliseconds; our Datastream provides real-time WebSocket feeds for prices, trades, launches, wallet activity and volume, with 20+ room types and unlimited messages.
Our price data, volume figures, market cap calculations and other derived metrics are estimates and may differ from other sources. Evaluate field definitions and coverage, not just whether the displayed prices match.
Solana Tracker offers indexed Solana market data and live streams for building token dashboards, wallet tools and trading alerts. Visit Solana Tracker to choose a feed, test it against a specific token workflow and add freshness and liquidity checks before acting on its numbers.