Sorting DEXs by 24-hour volume and trading at the top of the list is the most repeated advice in crypto, and it's the advice most likely to cost you money. Volume tells you how much other people traded. It says nothing about what your order will pay.
A DEX ranking that survives contact with a real trade answers a narrower question: for this pair, at this size, right now, which venue delivers the best executed price after fees and slippage, and how much should we trust the answer? What follows is the method behind that question, with formulas, windows and failure modes spelled out.
Core Metrics Every DEX Ranking Needs
Solana ranked first among blockchains for DEX volume in every quarter of 2025 and represented about 33% of total DEX trading volume for that year, according to Galaxy Research's Q4 2025 review. At that scale a leaderboard position represents real flow, and a scorecard built from one number is expensive. Seven metrics carry most of the weight.
| Metric | What It Shows | Formula |
|---|---|---|
| Volume | Total value traded in the window | Sum of swap notional in USD |
| Liquidity | Value available near mid-price | USD value of pool reserves within ±2% of mid-price |
| Spread | Gap between buy and sell prices | (Ask minus bid) ÷ mid-price |
| Price impact | Cost of a trade of a given size | (Fill price minus mid-price) ÷ mid-price |
| Fees | Cost charged per swap | Pool fee rate × trade size |
| Reliability | Share of swaps and quotes that succeed | Successful ÷ attempted |
| Unique traders | Breadth of demand | Count of distinct wallets per window |
Volume is the sum of swap notional in USD inside your window. Liquidity is the part a trader can reach, which means the USD value of reserves sitting within roughly ±2% of mid-price. CoinGecko's exchange methodology measures order-book spread and depth around that band, adds trading volume, trade frequency and outlier checks, then tests whether reported figures hold up against a benchmark set of high-confidence venues.
Spread is ask minus bid, divided by mid-price. Price impact is fill price minus mid-price, divided by mid-price, and it only means something next to a trade size. A 2% impact on a $500 order says nothing useful about a $50,000 order.
The number most boards get wrong: liquidity isn't total value locked. It's the depth close enough to mid-price that an order can reach it without moving the price far.
Where the ratios beat the totals
Fees are the pool fee rate multiplied by trade size, so a $10,000 swap at 0.25% pays $25 before any slippage. Reliability is successful swaps and quotes divided by attempted ones, and failed swaps inflate attempts without producing fills. Unique traders counts distinct wallets in the window, which separates broad demand from a handful of wallets running a loop.
A pool with $2 million in reserves and $500,000 of daily volume carries a volume-to-liquidity ratio of 0.25, so a quarter of its depth turns over every day. Push that ratio far higher on a small pool and you're looking at churn rather than depth.
For a first comparison, start with three: volume for scale, price impact at your trade size for cost, and reliability for whether the quote you saw is the quote you get.
Choosing the Measurement Window
The window is part of the metric, not a display setting. Change it and the leaderboard changes with it.
| Window | Best Used For | Main Risk |
|---|---|---|
| 1 hour | Spotting live spikes and launch activity | Small sample, easily inflated |
| 24 hours | Daily leader lists and dashboards | Dominated by one-day events |
| 7 days | Smoothing short bursts and trend checks | Slow to reflect sudden shifts |
| 30 days | Structural market share | Hides recent changes |
Say a token launch produces 60% of a venue's 24-hour volume. That venue tops the daily list. Its 30-day share barely moves, because one loud day inside a month of ordinary trading is a rounding error. Same venue, same trades, two very different ranks.
Longer cycles behave the same way. Aggregate DEX spot volume fell from $1.85 trillion in 2021 to $948 billion in 2023, then recovered to $2.63 trillion in 2024, up 177.3%, according to a DEX market report covering 2020 to 2026. A ranking pinned to a single year describes a market that no longer exists.
Leadership rotates inside the year too. Coinperps' Uniswap statistics record Uniswap holding 34.5% of top-DEX volume in December 2024, Raydium leading in January 2025 at 27.1%, and Uniswap back at 35.9% of tracked DEX volume in August 2025.
Publish at least two windows, 24 hours and 7 days. The daily view catches what's live. The weekly view tells you whether a lead is durable or a single event wearing a crown. Label every rank with its window and the date it was measured, in the title or caption rather than a footnote.
Data Sources, Endpoints and Sample Queries
Three layers of data
On-chain swap records are the most direct measure of activity. You decode the swap events and pool instructions that settled, rebuild notional from token amounts, and you own the definition of what counts.
A market data API with token, pool, trade and price endpoints removes the indexing work and gives you consistent history across venues. Real-time streams cover the live case: new pools, fresh fills, and monitoring rather than reporting.
The attribution trap
A liquidity venue and the aggregator routing through it are different businesses with different economics. A snapshot of Solana's spot DEX market identified PumpSwap, Orca, BisonFi, Raydium and Meteora among venues contributing to about $63 billion of 30-day spot DEX volume, per The Chain Observer's aggregator volume report. Credit routing volume to the pool that executed and every downstream rank is wrong, including your own.
Query patterns to start from
These are illustrative shapes, not exact endpoint names. Confirm the parameter names in the provider's documentation before you build against them.
?token=<mint>&window=24h&dex=onlyreturns DEX trades for one mint over the last day, with aggregator transfers filtered out so routing volume doesn't get counted twice.?pool=<address>&window=7dreturns pool-level volume for the week, which is the unit that fills an order.?token=<mint>&window=24h&grouped=truecollapses a window into transactions so a multi-hop swap isn't counted once per leg.
The Data API documentation from Solana Tracker is one place to see how token, pool, trade and price parameters line up against real responses.
Three visualisations earn their build time. A bar chart of 24-hour volume by venue shows concentration at a glance. A line chart of price impact against trade size shows the point where a venue turns from cheap to expensive. A table of unique traders and reliability shows whether volume comes from many wallets or a few.
The query checklist is short: pick the token, pick the window, filter to DEX activity, group by pool, and export the result with its timestamp attached.
How to Calculate Each Metric Step by Step
Cleaning comes before counting, because the order of operations decides whether your numbers survive an audit.
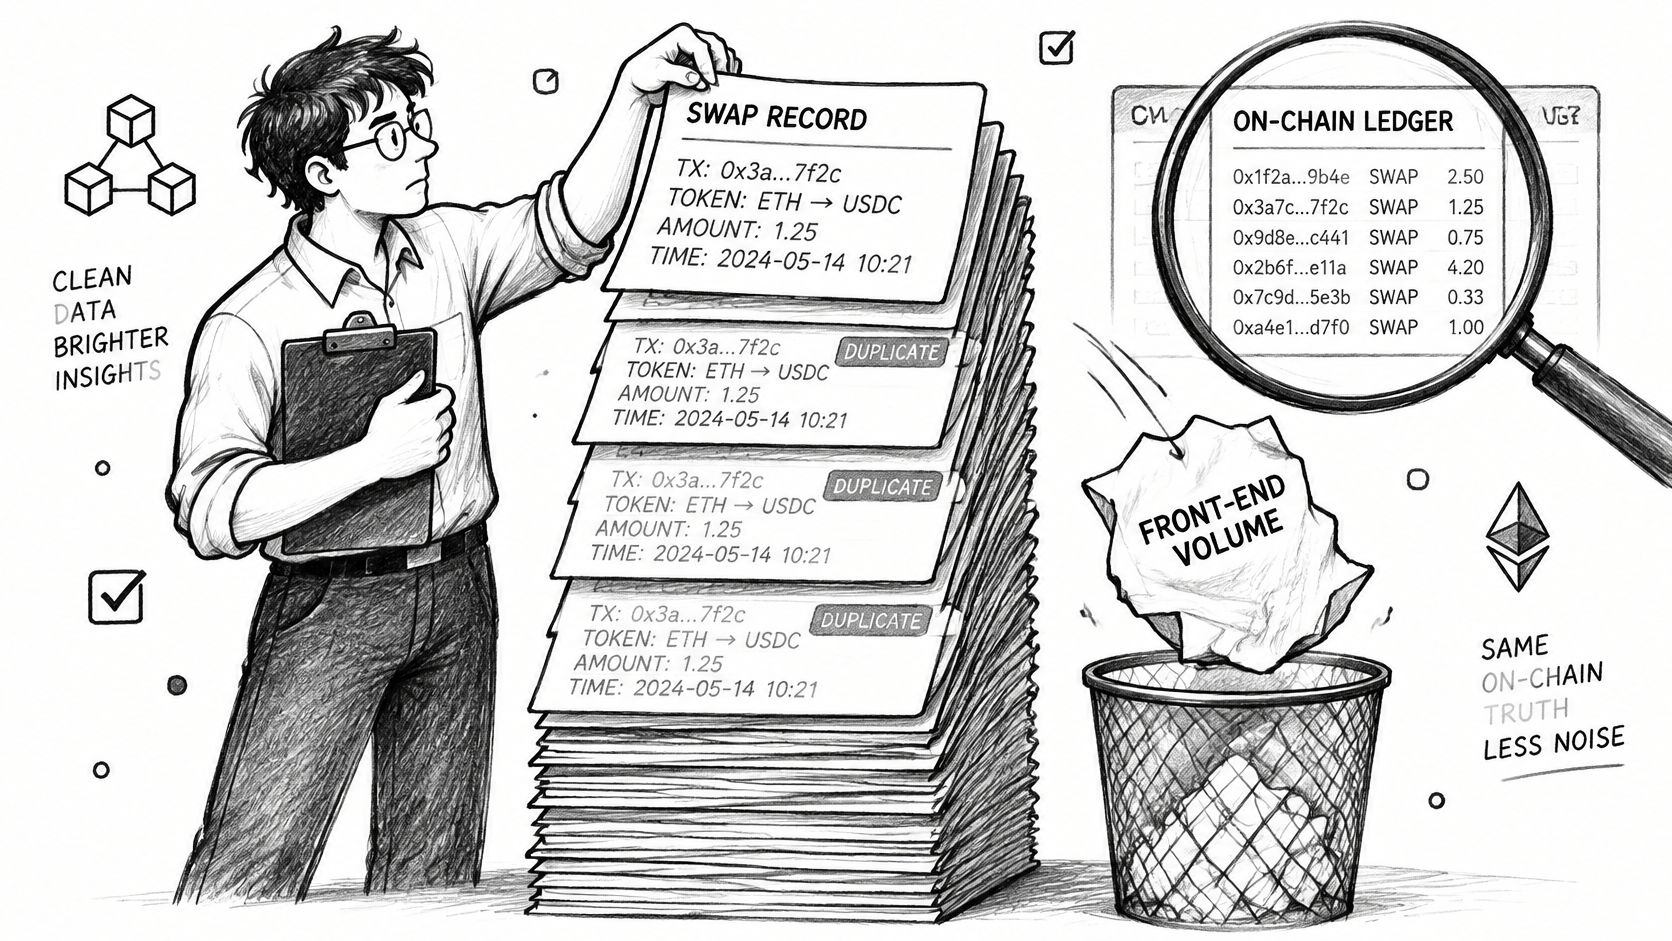
- Collect every swap record for the pair or venue inside your window, from chain data rather than a front end. Front-end figures can be self-reported, and a self-reported figure can't be audited.
- Drop duplicate records and failed transactions. A reverted swap inflates attempts without producing a fill, so leaving it in punishes the venues that revert cleanly instead of the ones that fill.
- Normalise token decimals so amounts are comparable. A six-decimal stablecoin leg and a nine-decimal SOL leg otherwise produce nonsense totals.
- Convert each leg to USD using a reference price you name. Note which feed you used, because a different price source moves notional by percent-level amounts on volatile pairs.
- Group by pool first, then by venue. One busy pool shouldn't hide five weak ones sitting under the same brand.
- Calculate volume, unique traders and reliability per group. These three need no simulation, so they're your fastest sanity check on the raw data.
- Simulate a fixed trade size against current reserves, $10,000 for example, including pool fees and token transfer fees. Constant-product pools are one formula. Concentrated liquidity needs tick crossing, so simulate against the ticks your route would touch.
- Score with published weights, for example 30% volume, 30% depth, 20% price impact and 20% reliability, then ship the score with a timestamp and a confidence flag.
Why weights must be published: a reader who can see the weights can argue with them. A reader who can't is being asked to trust a verdict.
The inversion this method produces is the whole point. A venue with strong volume but 3% impact at $10,000 ranks below one with 40% less volume and 0.8% impact. Same pair, same minute, better fill.
Ranking by Executable Depth at Real Trade Sizes
Headline volume ranks popularity. Executable depth ranks the thing you're about to do.
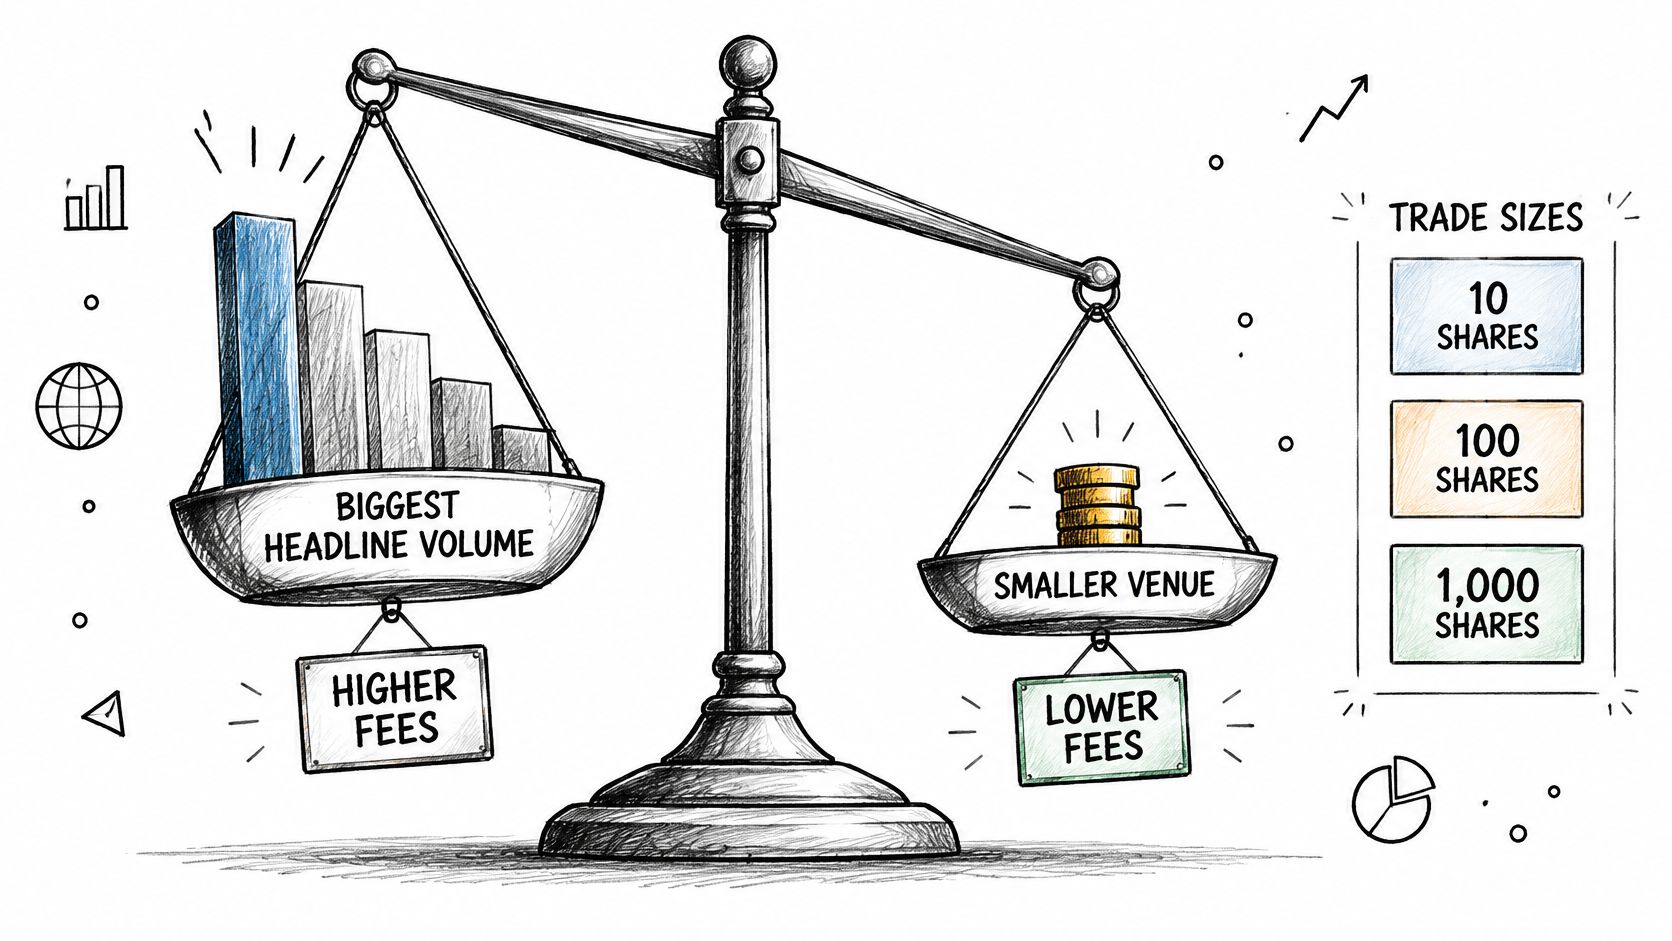
CoinGecko's trust score methodology makes the case directly: depth and price impact are more actionable than nominal volume, so a venue should be evaluated at standardised sizes such as $1,000, $10,000 and $100,000 using executable quotes rather than reserves or displayed liquidity.
Each size measures a different cost. At $1,000 you're measuring quote-to-fill slippage, which is the base spread a retail trader pays. At $10,000 you're measuring price impact and fee-adjusted cost. At $100,000 you're measuring median and 95th-percentile impact across routes, and that's where thin pools expose themselves.
Here's the contrast that matters. Venue A carries the highest 24-hour volume on a SOL-to-USDC pair and charges 0.9% price impact on a $10,000 swap. Venue B carries 40% less volume and charges 0.3%. For that order, B is the better venue by a wide margin, and any list putting A first for that size is answering a different question than the one the trader asked.
Aggregators sharpen the effect. Research on aggregation and execution describes routers comparing Raydium, Orca and Meteora and splitting a single SOL-to-USDC transaction across pools when that produces a better effective price. The best-ranked route for a $10,000 swap can therefore run through a pool that isn't the largest by headline volume.
Three things deserve a penalty in the score, not a footnote:
- Stale quotes that were never executable at the moment they were captured.
- Failed transactions, because a route that reverts has a real cost even when it shows a good price.
- Single-pool dependence, since a venue whose depth sits in one pool is fragile the moment that pool rebalances.
Rank separately for each size you care about. A trader moving $800 and a desk moving $250,000 need two different lists.
Separating Real Demand From Incentive Volume
The assumption worth attacking is that the highest-volume venue is the best venue. Volume is an output. Demand is an input, and the two diverge more often than leaderboards admit.
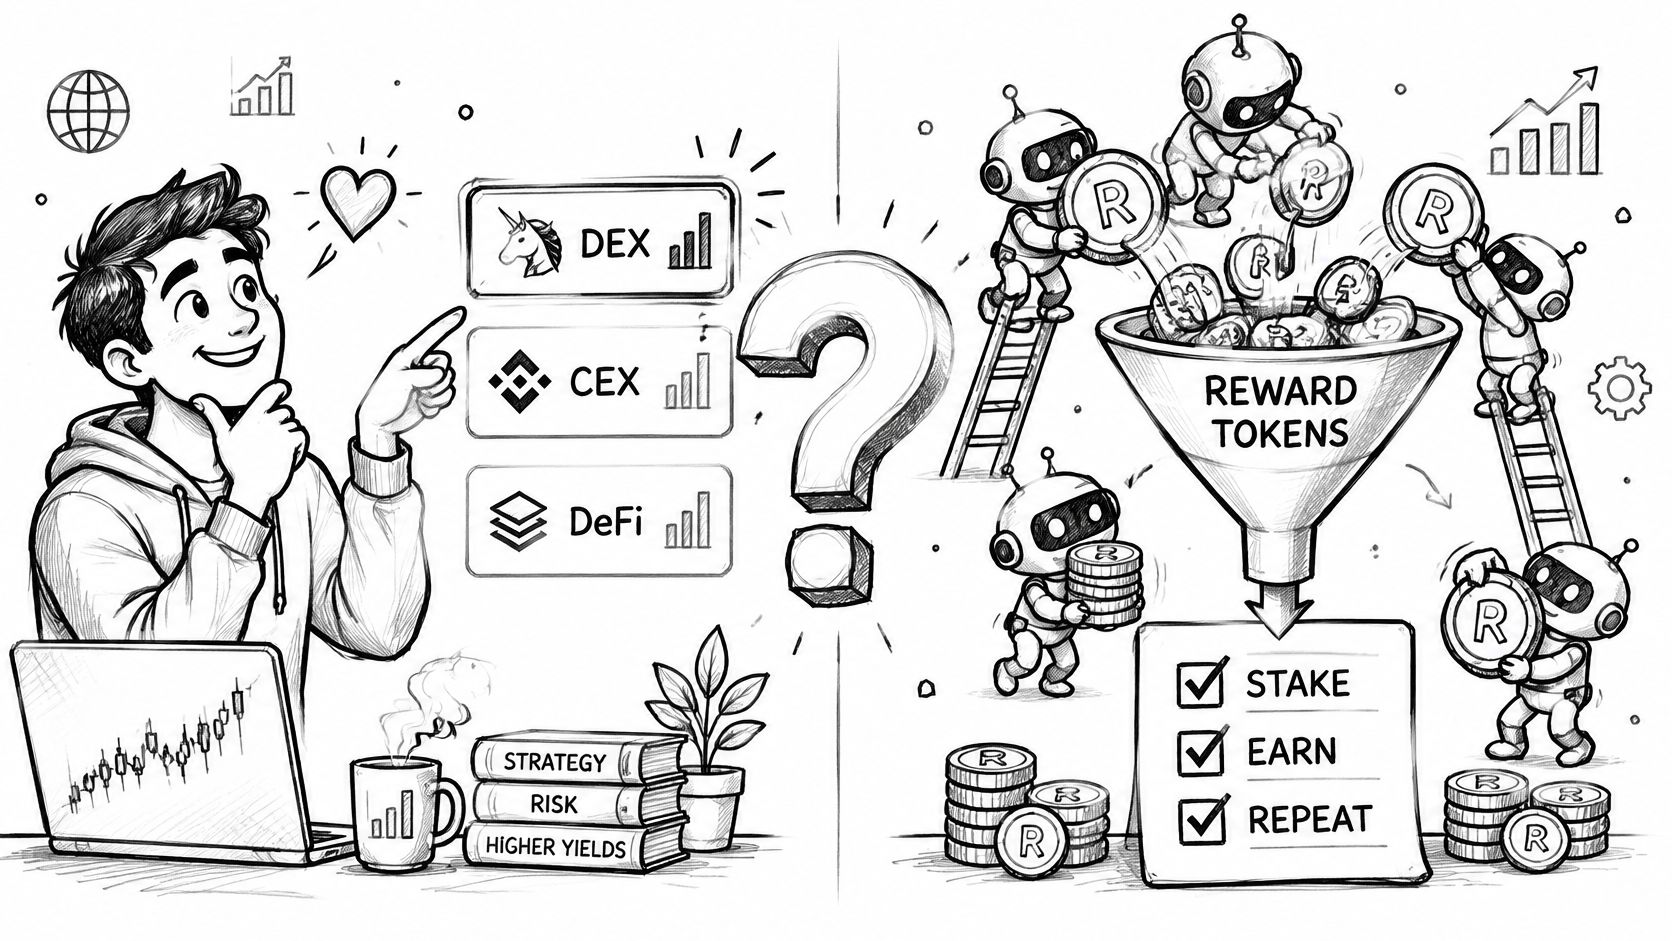
Ask of any top-ranked venue: is it winning because traders choose it, or because rewards and bots are manufacturing activity that clears before the next epoch?
The distinction is easier to see once you map where rewards, routing and automated flow enter the picture.
Six checks separate the two:
- Volume against unique traders. High notional from few wallets is the classic mismatch.
- Repeat-trader retention across weeks. Real venues keep the same wallets coming back.
- Top-five wallet concentration. The share of volume held by the five largest wallets tells you how broad the demand really is.
- Volume-to-liquidity ratio. A ratio far above the market's normal churn signals hot money passing through.
- Average trade size. A flood of tiny trades points at automation rather than intent.
- Share of volume inside known incentive periods. If most of the week's volume lands in a rewards window, the rank describes the campaign, not the venue.
Say a venue reports $50 million of daily volume from 300 wallets, and the top five wallets account for 70% of it. That profile is concentrated flow with a public leaderboard attached. It doesn't mean the venue is broken. It means its rank is measuring something other than broad demand.
Solana's spot DEX volume rose from $693.6 billion in 2024 to $1.47 trillion in 2025, and Jito tips reached 4,252,425 SOL, about $543.45 million, during 2025, according to DefiLlama's State of DeFi 2025 report. Transaction-ordering economics can carry a meaningful share of that flow without telling you anything about durable users.
The contrarian conclusion holds up under the numbers. A lower-volume venue with persistent liquidity, lower price impact and less concentrated flow can deliver better execution and more sustainable market quality than the top-volume venue. Rank it higher.
Why Rankings Disagree and How to Fix Them
Two credible sources disagreeing about one venue's volume is normal. The disagreement is information once you know which methodological choice caused it.
| Symptom | Likely Cause | Fix |
|---|---|---|
| Sources disagree sharply on one venue's volume | Different pool filters and inclusion rules | Compare only methodologies with the same filters |
| Volume spike vanishes within a day | Incentive or launch-driven activity | Rank on 7-day and unique-trader data |
| Top quote fills worse than expected | Stale or unexecutable quotes | Recheck with a live simulation before ranking |
| Ranking shifts overnight with no market move | Provisional, unfinalized data | Use confirmed or finalized records as the reference |
| Aggregator receives credit for venue volume | Routing volume attributed to the wrong venue | Separate the execution venue from the router |
The widest gap on record is instructive. DexPaprika's comparison of top DEXs by volume found DefiLlama and DexPaprika agreeing within 8% on some large venues but differing by as much as 7.2 times for PumpSwap, because one methodology filtered for minimum pool liquidity and unique traders while the other counted thousands of pools without those filters. Neither is lying. They're counting different things under the same label.
The overnight-shift row is the one most analysts skip. A rank that moves with no market move usually means the underlying record wasn't final. Our REST liquidity history is recorded at confirmed or finalized commitment, while live liquidity streams deliver events at processed, provisional commitment, so the historical record is the safer basis for anything published.
Log every disagreement you hit alongside the fix that resolved it. Over a quarter, that log becomes a better methodology document than anything you'd write from scratch.
Build and Check Your DEX Ranking Weekly
- Pick one pair and one size that matter to your work, such as a $10,000 SOL-to-USDC swap. Ambition is the enemy of a first working rank.
- Compute the scorecard for that pair across the 24-hour and 7-day windows, then note where the two disagree.
- Audit the leader on unique traders, wallet concentration and reliability before accepting its position.
- Rerun it every week. Incentives, launches and routing change the order faster than most dashboards get refreshed.
Solana Tracker is one source for the raw inputs. The Data API exposes more than 70 endpoints covering tokens, wallets, trades, prices and risk scores, indexed and served in milliseconds. We aggregate, index and display publicly available blockchain data, so the calculation and the judgement stay with you. Risk scores are algorithmic assessments rather than guarantees of safety, and a low score doesn't make a token safe.
Run your first pass this week with one pair and one trade size. A small ranking you trust beats one you can't defend.
The same method you've just read runs on infrastructure we built for it. Solana Tracker's Data API covers tokens, wallets, trades, prices and risk scores across more than 70 endpoints, so you can pull the raw swap records behind any DEX ranking and compute the scorecard yourself. Start with one pair and one trade size, then visit Solana Tracker to see what the endpoints return.